Remote Sensing and Near-Infrared Imagery
Understanding and Interpreting NIR Imagery.
Remote Sensing
What are we looking at?
Satellite and aerial imaging sensors, which are used primarily in vegetation detection, record energy related to specific wavelengths within the electromagnetic spectrum. These wavelengths are most sensitive to biomass changes.
These include, but are not limited to: the visible blue, green, red and near-infrared (NIR) area of the electromagnetic spectrum.
Each of these wavelength spectrums are sensitive to vegetation in unique ways and are used to create relative biomass "maps" of individual fields.
The use of digital sensors and the Sun (as a source) allow us to record every intereaction a wavelength has with objects on Earth.
These wavelengths (energy) are reflected or absorbed by those objects and can be recorded. These records can then be used to create digital maps.
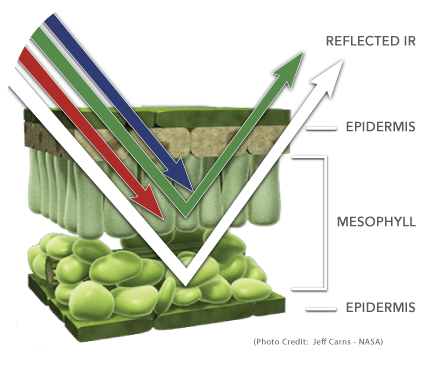
Each part of the plant reflects or absorbs different Electro-magnetic wavelengths (white arrow represents NIR)
Near-Infrared Imagery
Why do we use Near-Infrared (NIR) to make maps?
Simply put, a plant with more chlorophyll (biomass) reflects more near-infrared (NIR) energy.
Furthermore, as a plant begins to stress, more NIR energy is absorbed. Long before we see with our eyes the stress on a plant (such as a change in the color of the plant), the NIR reflectance has already proved this stress.
In other words, as biomass increases, NIR reflectance also increases and vice versa.
Plants also absorb visible blue and red energy to help with photosynthesis. The more chlorophyll, the higher the photosynthesis and the more absorption of these wavelengths.
This is why we see plants as green. The pigments in the leaves and other parts of the plant reflect the visible green energy.
In short, each wavelength is important as each can be used with the NIR wavelengths in various circumstances to determine biomass and plant health issues.
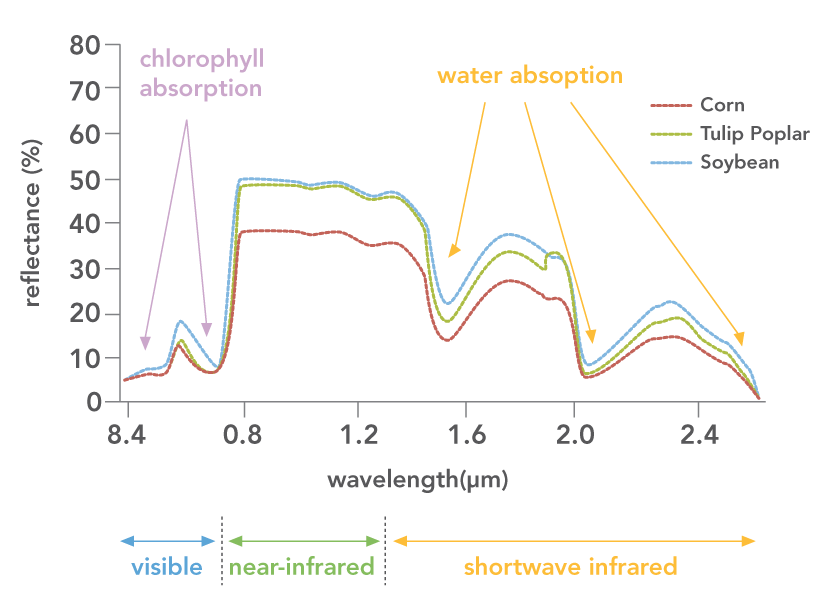
Spectral signatures on how the plant reflects or absorbs electromagnetic energy (Photo Credit: Eric Brown de Colstoun - NASA)
Imagery Pixel Comparisons
Types of Vegetation Indices
A closer look at formal imagery enhancements.
The Satshot system gives the user the choice of 8 different analyses, which include 6 vegetation indices.
[1] NIR
Near-Infrared
The NIR analysis is the near-infrared band based on the sensors set wavelength range and will show the most amount of detail or variability. Soil influences can be present when there are smaller canopies or less biomass.
[2] NIR: Red-Edge
Near Infrared: Red-Edge
This band records wavelengths in the transition between the red absorbance and the NIR reflectance bands with no overlap in either.
[3] NDVIR
Normalized Difference Vegetation Index-Red
NDVIR is a simple vegetation index that allows the use of the NIR and visible Red channels.
Soil may influence the NIR analysis and cause higher than normal biomass readings, so NDVIR uses the visible Red channel to "normalize" the biomass readings.
As discussed previously, the relationship between the NIR and visible Red reflectance is inverse in plants. Bigger difference equals a healthier plant. NDVIR helps to alleviate a false-positive from soil interference.
[4] NDVIG
Normalized Difference Vegetation Index-Green
NDVIG uses the same formulation as NDVIR, but uses the Green channel for normalization.
The Green channel has a direct relationship with NIR as research has shown that this index is more sensitive to chlorophyll differences than NIR alone.
[5] NDVIRE
Red Edge Normalized Difference Vegetation Index
NDVIRE is a modification of the traditional broadband NDVI.
This index differs from the NDVI by using bands along the Red Edge, instead of the main absorption and reflectance peaks.
The NDVIRE capitalizes on the sensitivity of the vegetation Red Edge to small changes in canopy foliage content, gap fraction, and senescence.
Interpreting RAW Imagery
The truth in the false-colored imagery.
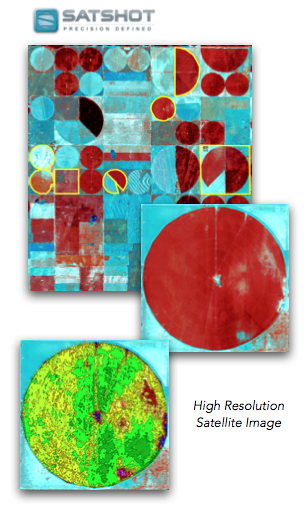
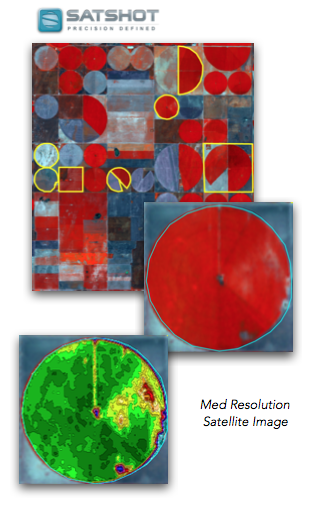
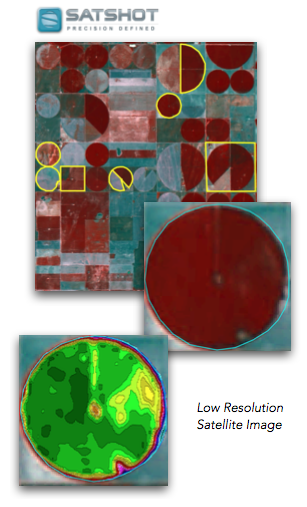
False-colored imagery refers to an image that uses the NIR, Green and Red channels instead of Red, Green and Blue. Therefore, these images appear as variations of red and blue when viewing them in any Satshot software.
In highly vegetated areas, an image will appear light to dark red, depending on the amount of vegetation, In turn, areas that have little or no vegetation will be in shades of blue or grey.
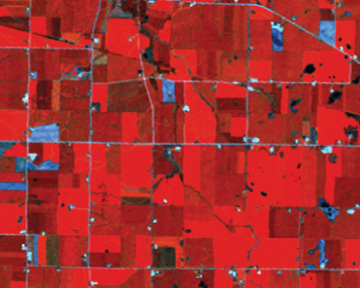
(Figure 1): Dekalb County, Illinois - Early August - Corn appears as darker-duller red vs. Soybeans as brighter red.
Furthermore, water will typcially appear black, unless there is algae in the water. Structures and roads will likely appear bright grey, blue or white. Over time, a user will learn to identify these color differences in NIR-view and will be able to determine unique vegetation features, such as different crop-types. (Figure 1)
Red River of the North is snaking through the center of the image with the southern suburbs of the Fargo-Moorhead Metro area starting to appear at the top. (Figure 2)
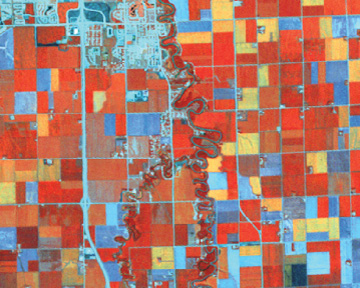
(Figure 2): Red River Valley - MN-ND - Mid August showing Corn-Soybeans(red shades) - Sugarbeets(yellow-orange) and harvested small grains (blue-grey).
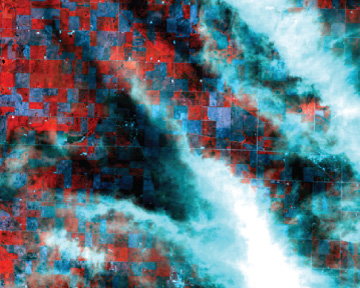
Recognizing Clouds
Examples of clouds in Landsat imagery.
Learning to recognize the nemesis of remote sensing, clouds and their partners, shadows, is important.
Since the data between the clouds is still good information and can be used in biomass analysis, the Satshot system has many images online that contain clouds.
Clouds are usually seen as bluish hued or white blobs of solid mass, but clouds can sometimes be more subtle and smaller than you think.
After a while though, clouds become more recognizable to the trained eye. Remember that, once a cloud has been spotted, there is always a shadow associated with it.
In the US and Canada, a cloud's shadow is usually to the North (top of map) of the associated cloud.
Shadows move further North in the imagery as Fall draws near. Also, a cloud's shadow is black and can look like standing-water, but usually have the same outline as their associated cloud.
If you are unsure that there is a cloud or shadow over your field, zoom out to take a wider view of the area.
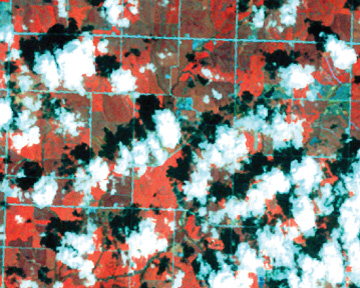
(Figure 3): Cumulus - Typical “Popcorn” Style. In North America, the shadows are spotted North and West with respect to their cloud.